After the Grayscale Bitcoin Trust ETF’s historic spike to new highs, it would be natural for investors to get spooked by a bearish daily chart pattern on the day after its most extreme “overbought” reading in more than six years.
The exchange-traded fund’s GBTC trading history — going back about nine years, well before it converted to a spot bitcoin ETF — shows that being really overbought is much more a sign of its bullish ability than a warning of an impending correction. But what might make this time different is the “bearing engulfing” pattern that appeared on Tuesday.
Before Grayscale Bitcoin Trust’s 8.5% selloff in afternoon trading Tuesday, it had soared 32.4% amid a six-day win streak to close Monday at a record high.
Chart watchers try to put a rally like that in historical perspective by tracking the relative strength index (RSI), a momentum indicator that measures the relative magnitude of recent gains and losses.
RSI readings above 70.00 are viewed by many as signaling an overbought condition — which suggests the charted instrument has moved up so fast relative to historical trading patterns that a pause or a pullback may be needed to allow bulls to catch their breath.
In Grayscale Bitcoin Trust’s case, the recent rally had lifted its RSI to an extreme overbought reading of 87.12 on Monday, before falling to 70.44 on Tuesday.
Monday’s RSI close was the highest seen for the ETF since it peaked at 88.01 on Dec. 18, 2017, when its price closed at a then-record high of $38.05. The fund plummeted 89.9% over the next year, to close Dec. 14, 2018 at $3.84.
That does seem daunting for investors. But Frank Cappelleri, technical analyst at CappThesis LLC, said that rather than caring about the last time the RSI was so high, he’s more concerned with “the first time” the measure rose above 85 before the ETF peaked.
“And as is clear, the indicator first surpassed 85 back in November 2015, which means [the ETF] had two more years before topping out,” Cappelleri wrote in a note to clients.
That first time was a 91.06 close on Nov. 14, 2015. While there were no closes above 85 in 2016, there were nine others in 2017 before that final reading on Dec. 18.
If history is a guide, extreme overbought readings may not be so bearish.
FactSet, MarketWatchDespite all those extreme overbought readings, the ETF soared 1,557.2% in 2017. That means a charted instrument’s ability to produce multiple overbought readings can be viewed as a sign of underlying strength.
Read: Meta’s stock is the most overbought in 11 years, but that could be a good thing.
Meanwhile, as Cappelleri pointed out, Monday’s extreme reading wasn’t actually the first in recent months. Grayscale Bitcoin Trust’s RSI closed at 85.03 on Oct. 24, 2023, and at 86.25 on Oct. 25. Despite Tuesday’s pullback, the fund is still up about 111% since then.
But before using Tuesday’s selloff to jump back in, there is a short-term bearish reversal pattern that appeared Tuesday — known as a “bearish engulfing” or a ”key reversal” — that warns bulls may need more time to refuel before making another push higher.
On Monday, Grayscale Bitcoin Trust opened at $58.45, and traded in an intraday range of $$58.39 to $60.70, before closing at a record high of $60.38.
On Tuesday, the ETF opened above Monday’s close at $60.41 and rose to an all-time intraday record of $61.99, before pulling a sharp U-turn. It hit an intraday low at $55.01 before paring some losses to close at $55.23, below the previous session’s low.
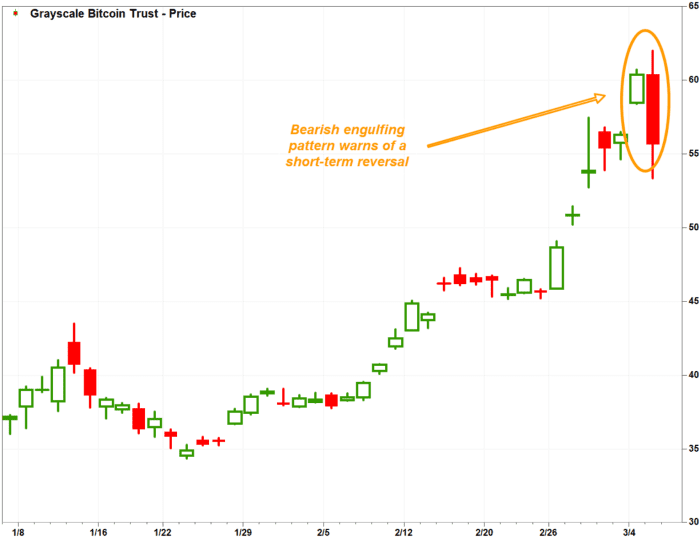
A bearish engulfing pattern warns that the selloff might last a bit longer.
FactSet, MarketWatchThe pattern suggests that Monday and early Tuesday marked a buying climax, while Tuesday’s intraday reversal suggests bears have launched a successful counterattack. And though this pattern is short-term in nature, its appearance after an extreme overbought reading may give it more credence.
Some downside levels to watch include the gap in the charts between the Feb. 27 intraday high of $51.45 and the Feb. 28 low of $52.70.
Many chart watchers believe previous upside gaps in charts define support zones on pullbacks — the idea being that those who sold before the stock gapped higher would be happy to buy when given the opportunity.
There’s another gap between the Feb. 26 high of $49.06 and the Feb. 27 low of $50.21.
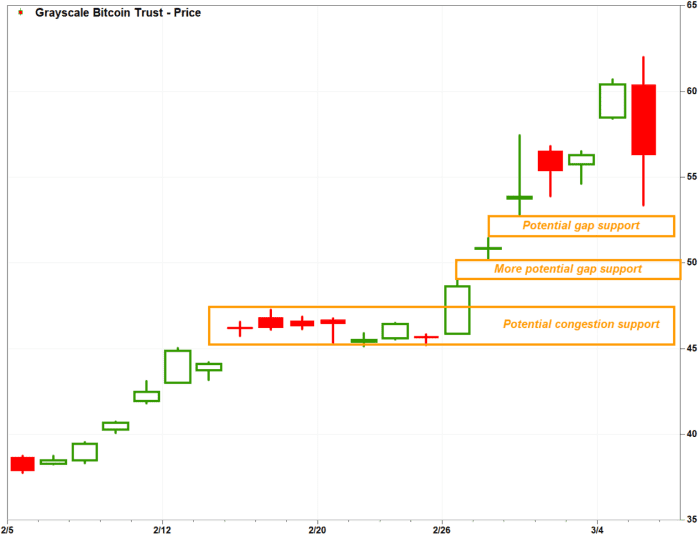
GBTC’s potential support zones are below current levels.
FactSet, MarketWatchAnd below that, previous areas of some congestion often provide support zones. The area marked by the Feb. 15 high of $47.26 and the Feb. 21 low of $45.14 could be rather significant, since a decline to that area would suggest a bear market has begun.
Many on Wall Street define a bear market as a 20% or more decline from a significant peak. Starting at Grayscale Bitcoin Trust’s record close of $60.38 on Monday, a bear market would then kick in with a decline to $48.30 or below.